There are three kinds of car driver…
-
26 June 2020
-
EA Technology
As electric vehicles become increasingly popular, we need a charging infrastructure that meets the needs of all drivers. This isn’t as simple as it sounds: we could put chargers everywhere – but that might mean millions of chargers end up in the wrong place. We could “wait and see” – but that would result in queues for charging and angry drivers. Both of these options would be expensive: either we waste money on redundant infrastructure, or we waste money urgently installing charge points under duress.
There is a solution: if we model driving behaviour and charging preferences, we can work out in advance where the charge points need to go. Simple, right?
As part of her recent PhD thesis, Constance Crozier looked at this problem in detail. If we knew what the behaviour was of every single person, we could answer this question with a great deal of accuracy. But we don’t, so we can’t. Perhaps we could simplify the problem by assuming everyone behaves according to some kind of “average”? Or would this be a mistake?
Thanks to the National Transport Survey (NTS) in the UK, we know that private cars tend to be parked at home at night and many of them spend the day parked at work during the week. More importantly, we know the numbers.
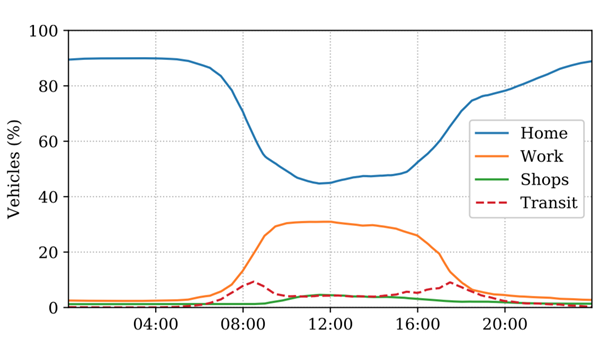
Figure 1 The percentage of the UK private vehicle fleet at common locations throughout a weekday
This is gives us a useful idea of where cars are most likely to be at any given time. Location when parked is important, because, that’s where charging of electric vehicles can take place.
The next thing we’d like to know is “how much charging is needed?” Much like the fuel in a petrol tank, the further and faster an electric vehicle is driven, the more energy it needs to replenish the battery. So, distance driven is a good indicator of how much charging will be needed. Again, thanks to the NTS, we know the journey distances (and speeds) to a reasonable accuracy. We can also compare UK habits with other countries.
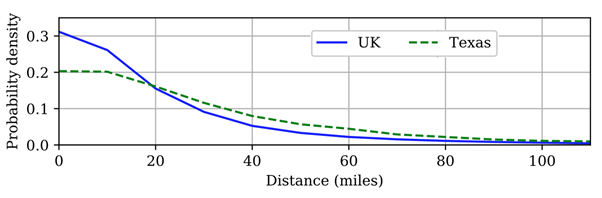
Figure 2 A comparison of daily driven distance exhibited in two travel surveys
Using the above data, we can work out where to put the charge points and how much energy they will need to provide. Problem solved, right? Let’s have a look at some real-world home-charging behaviour from a single vehicle in the My Electric Avenue (MEA) trial.
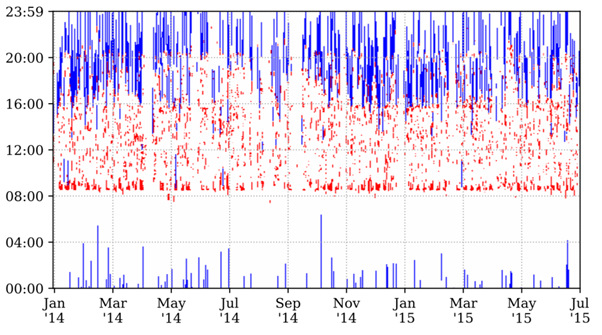
Figure 3 Vehicle usage profile from the MEA data. Date is on the horizontal axis, and time on the vertical. Red shows vehicle use and blue shows charging.
We can clearly see that the vehicle was usually driven “during the day”. We can also see that charging tends to happen “overnight”. But there are huge day-to-day differences. We see similar differences between cars and drivers. Taking an average of all of this would give the wrong answer; it turns out there is no such thing as an average day, an average car, an average driver.
If there’s no average, how can we break the problem down into something manageable? The answer is to use cluster analysis. This mathematical technique looks for patterns in the data and allows us to group behaviours into a sensible number of groups.
Using centroid-based clustering analysis of the NTS data, Constance was able to identify three distinct groups of drivers for weekday usage, and another three for weekends.
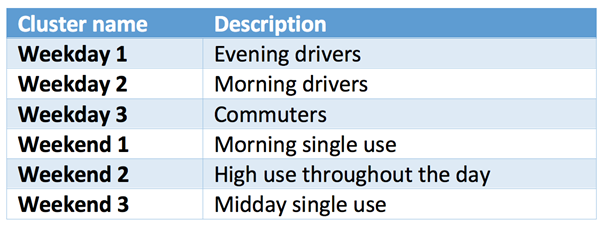
Table 1 Cluster characteristics for weekdays and weekends
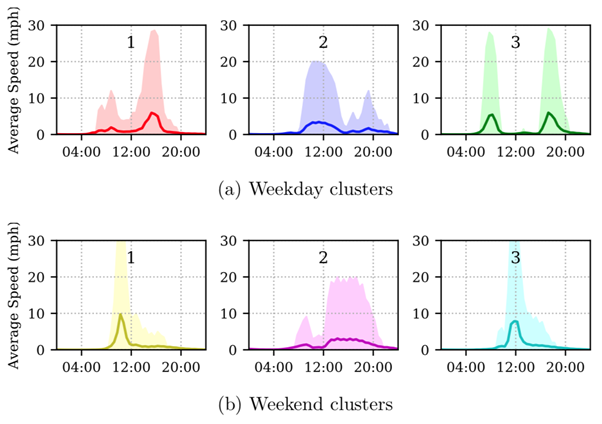
Figure 4 The average speed profile of the vehicles in each cluster. The lines show the mean values, and the shaded areas cover the 90% confidence interval. There is no significance to the ordering of the clusters.
So, on any given day, we can expect car usage to fall into one of the three clusters. We can also see how many drivers there are in each cluster, and how likely they are to remain in this cluster the following day.
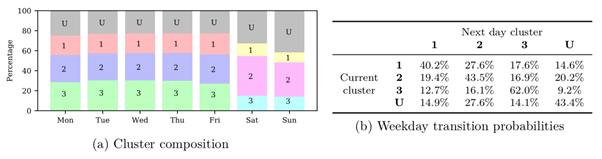
Figure 5 The variation in cluster composition throughout the week, and the probability a vehicle changes usage cluster the next day. U indicates the vehicle was unused.
Now we are getting somewhere: if we know how many drivers are in each cluster on each day (and where their car is likely to be parked), we can come up with an accurate prediction of the geospatial energy requirements for electric vehicles.
Which leaves us with one problem.
Just because a vehicle has been driven, this doesn’t mean it will actually be plugged into a charger at the end of that journey. Modern electric vehicles have enough battery capacity for several days of normal driving. Charging the vehicle is optional – and dependent on the preferences of the driver. Much like the way people charge their smart phones: some people charge every night. Some people charge whenever they can. And some charge only when the battery is empty.
Fortunately, the My Electric Avenue and Electric Nation trials provide us with (most of) the data we need…
My Electric Avenue was a pioneering electric vehicle trial that was completed in 2016 – when electric cars were still far from mainstream. The trial captured valuable data for both real-world vehicle usage and charging behaviour. However, the trial participants inevitably formed a biased sample: each participant had chosen to lease a Nissan Leaf. 67.3% of participants were male. 41% were within the 40-49 age bracket. However, if we quantify this bias by comparing the sample with NTS data, we can predict the likely error from extrapolating this trial data to represent a large fleet of vehicles.
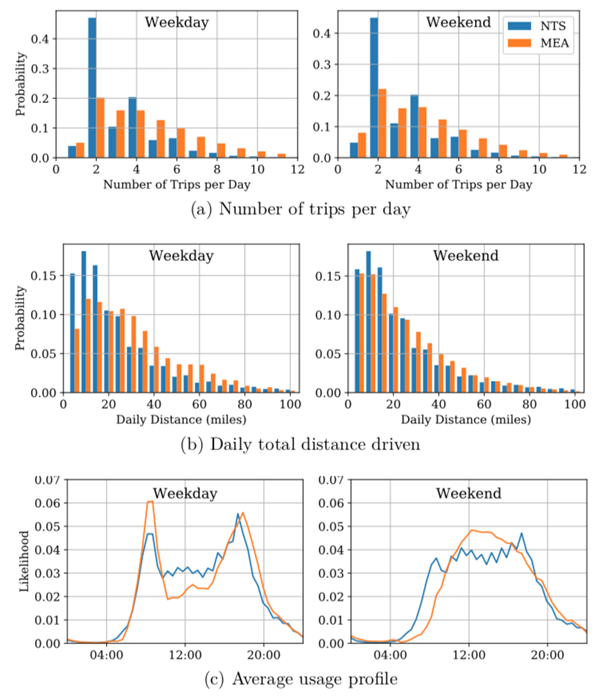
Figure 6 A comparison of the trip frequency, distance, and timings of vehicles from the NTS and MEA data.
We can see that the MEA vehicles are used more frequently at both weekdays and weekends, and travel further on weekdays - although the vehicles show broadly similar usage profiles to the NTS profiles.
Furthermore, we can compare the same clustering results with the NTS data.
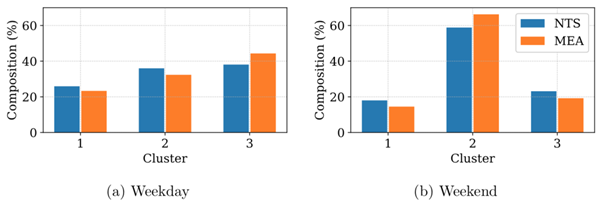
Figure 7 A comparison of the cluster composition of the NTS and MEA data.
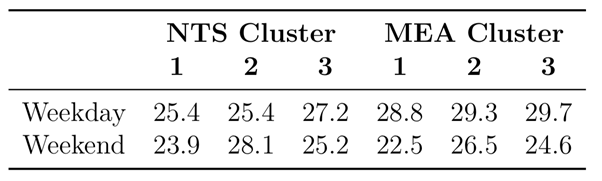
Table 2 The average distance travelled by each cluster (miles).
The cluster composition is broadly similar, although there is a slight bias in the MEA data towards weekday commuters. However, distance travelled varies more significantly – all weekday clusters travel further than average, and all weekend clusters travel shorter distances. Overall the average MEA driver travels 12% further than the average NTS driver on a weekday. Therefore, if we extrapolate form the MEA data to forecast national energy demand, we know what correction factor to apply.
So there we have it. We know on any given day, there are three types of drivers. We know what their usage pattern is, and what their energy requirements are, where they are parked and how long they can charge for. This tells us where the charging infrastructure needs to be and what type we need to install. We can even estimate their charging behaviour preferences to help with our business planning.
I hope this article has shown the value of modelling and analysis of real-world driver behaviour. We don't need to waste money building charging infrastructure where it isn't needed; nor do we need to "wait and see" - also known as "leaving it too late". We can plan ahead, and put the charging infrastructure exactly where it's needed, so that the needs of all drivers can be met. All this from a relatively simple model, some trial data - and some cleverly applied analysis.
In a future article, I will explore Constance's thesis a little further and look at the opportunities that emerge when driver charging behaviour is fully integrated with electricity grid operation...