Introducing the Next Generation Asset Methodology
-
12 March 2021
-
EA Technology
It’s here! The much anticipated next generation of the electricity distribution ‘Common Network Asset Indices Methodology’ also known by the catchy acronym CNAIM. Developed for the assessment, forecasting and regulatory reporting of asset risk in Great Britain, this methodology is based on more than 20 years of development and experience. This new version replaces its 2016 predecessor, for the 2023-2028 reporting period.
So what is this methodology about?
If you’re an owner or operator of electrical assets and you want to understand the asset health – it’s in the methodology. If you want to understand how to predict future asset health – it’s in the methodology. If you want to quantify the risk of an asset – well that’s in the methodology too.
If you’re an asset manager or planner, you need to understand your assets. The methodology helps you do just that. It takes a bottom up, procedural approach, coherently organising and maximising the use of existing asset data into meaningful results for each and every asset. These can then be aggregated across the asset fleet or combined into substations, circuits and networks.
Put simply, you can visualise the state of the assets now and in the future, and if you can do that, you can plan and justify investments.
It’s the accuracy, maturity, and transparency of the methodology that have led to network operators across the globe to implement versions of this methodology. But there’s a catch, the methodology was designed for distribution network operators in Great Britain and reflects their businesses, regulatory drivers, network and operating environment. So you can’t just pick it up and away you go, but it’s a pretty good place to start!
What’s NEW in this version?
If you’ve got a version of this common methodology within you’re organisation, you’ll already know it’s on the sophisticated edge of the maturity scale. How can we improve on that and what do these changes mean?
Well, on the surface, the changes look pretty insignificant, aside from the new concept of long term risk (which is a bolt on calculation at the end), the methodology is pretty much as it was with no modification to the overall principles. But dig a little deeper and you’ll find a whole series of coordinated updates that make the new methodology more complete, considered and refined whilst addressing some of the issues and ambiguities of its predecessor.
Here’s some examples..
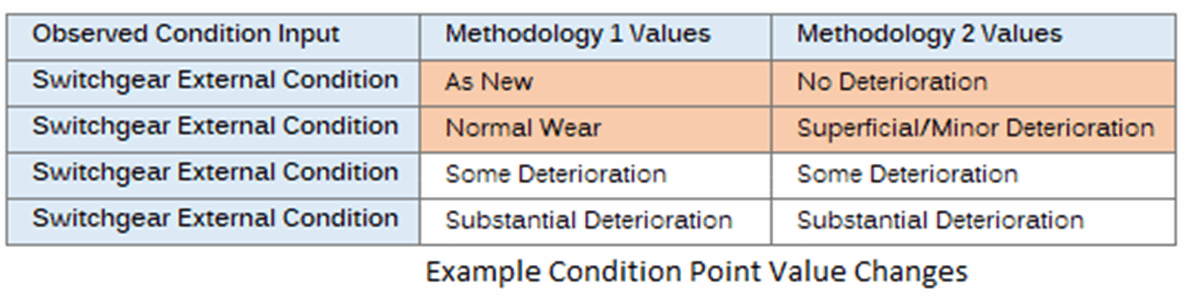
The observed data points in the model, the condition measures collected when you inspect an asset have adopted a new set of terminology, see below comparison. This new terminology makes it easier for inspectors to correctly assess each asset, as it’s more objective. A subtle change, yes, but leads to a direct improvement of data collection. Additionally, in most cases, the methodology includes 4 answer options for each question – this forces the inspector to make a more positive decision, if there were 5 answers – usually they’d pick the middle one!
There are a number of changes designed for regulatory reporting Great Britain, these revolve around the reporting risk using a 5 x 4 matrix representing asset health and consequences of failure. If you don’t report to Ofgem, you need not be concerned about a bunch of assets that represent the ‘average’ British asset in the matrix or the shifting of the criteria of the banding. Just go with what reporting mechanism makes sense for you.
A greater use of ‘collar’ values through the methodology forces the asset health to be a certain value when a condition measure is met, in particular to catch younger assets in poor condition. The method works well, but remember – the collars are deliberately set to ensure the assets fall into the correct regulatory reporting banding at the end – they won’t have the same impact if you’re using other reporting mechanisms.
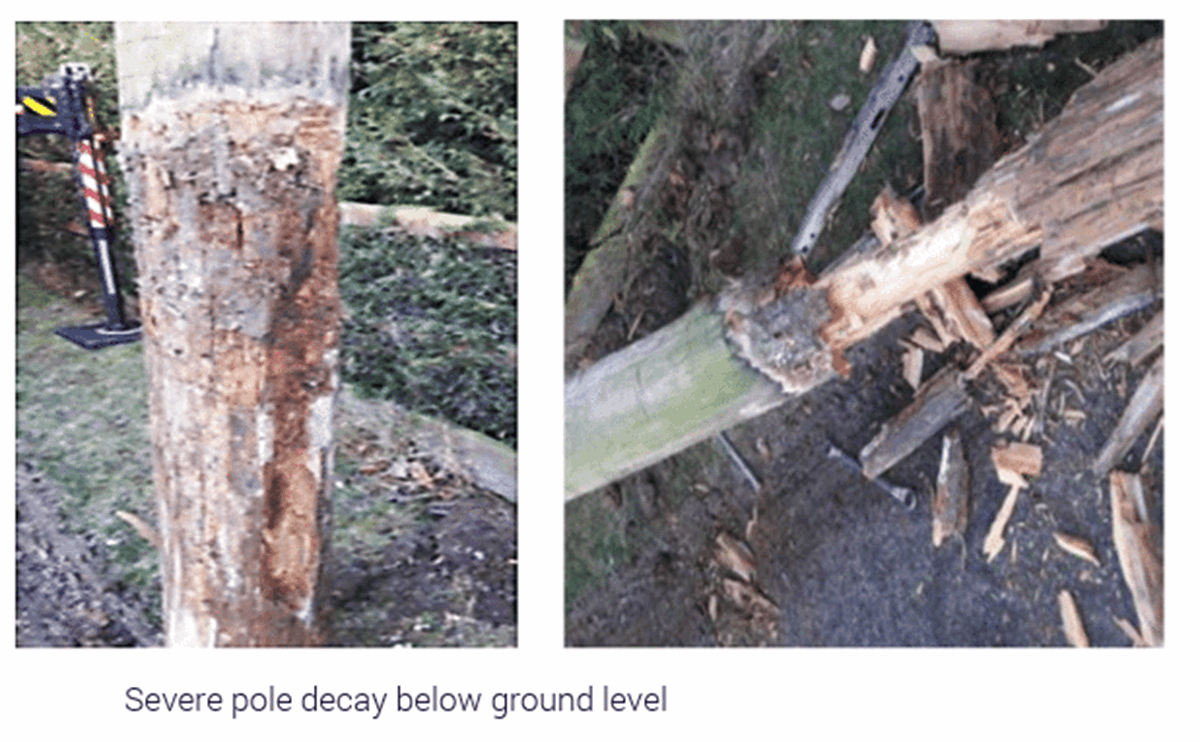
There are additions to the methodology to reflect changes relating to new behaviours within assets, for example, copper salt treated poles have a reduced lifespan due to degradation below ground level.
There are many other configuration changes, additional condition data points, oil tests and a safety risk reduction mechanism. These refinements run throughout the methodology, mostly just tweaking what’s already there but also adding granularity and improving the results.
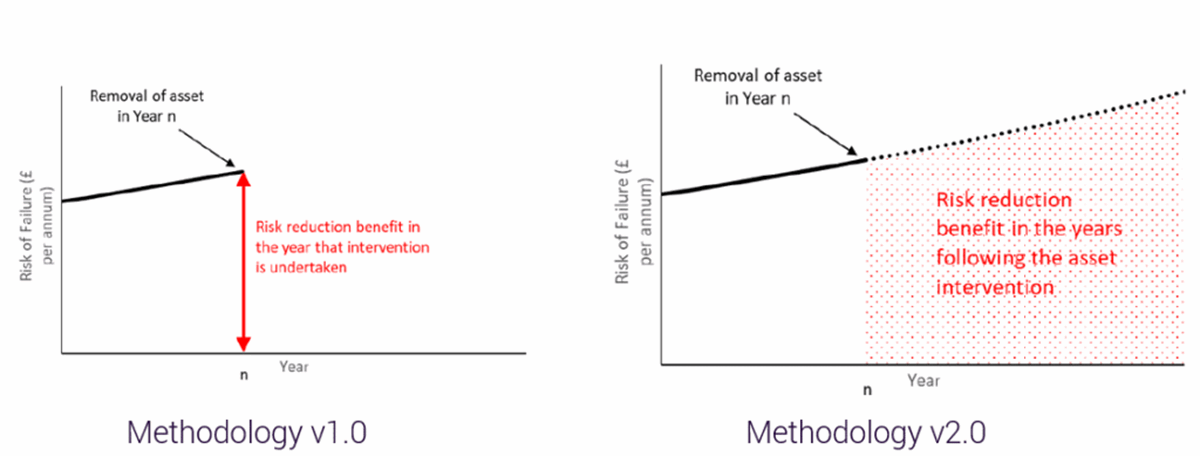
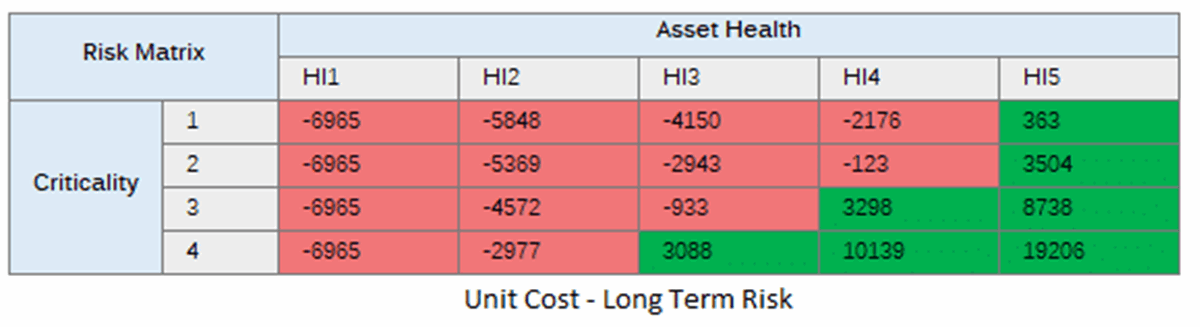
The concept of Long Term Risk is the most significant new development. In version 1, the measure of risk reduction when an asset is replaced, is represented in a single year. For the new methodology, Long Term Risk is calculated over the lifetime of the asset and therefore provides clearer visibility of the cost benefit justification of investments, realising the benefit in future years.
When considering the Long Term Risk and the like-for-like cost benefit it’s easy to see which combination of asset health and criticality have a positive impact. This can be visualised on the matrix below by subtracting the long term risk from the unit cost. Where there is a positive, the replacement can be justified.
So, what does all this mean?
These updates remind us that this methodology is one born from evolution and experience and we expect the methodology further expand and be developed into the future. Methodologies should not be static in nature but evolve to reflect the needs of the assets and the organisation.
There are lots of interesting updates and extensions that lead to improved results and extend its capability to justified investment decision making. This should be of interest to lots of organisations who are thinking of adopting this type of methodology.
To make the methodology work you need to understand not just the ‘how’ but the ‘why’. With careful consideration, adaptation of the methodology can be done to suit any asset owner or operator, and not only that, it may be extended to include further asset types and automated investment decision support and tracking. Solutions such as EA Technology’s {Asset Investment Management} are based upon the theory of the methodology but are also flexible and adaptable to meet the needs of the client organisation.

We hope you’ve enjoyed this article, if you would like to discuss your experience with the methodology or find further information please contact at joanne.peacock@eatechnology.com
