Case Study: LV Monitoring Predicts the Distance to LV Cable Fault Caused by Car Collision
-
14 April 2023
-
Brad Monaghan
Background
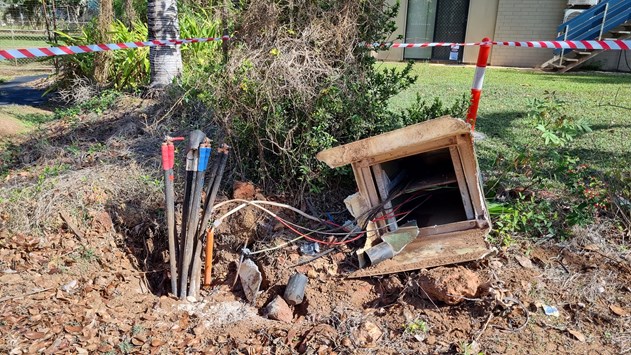
On an early Sunday morning at 6am, a 240/415 volt distribution pillar box on the side of a residential street was run over by a car, exposing bare live low voltage (LV) conductors to the general public.

(Figure 1: LV pillar crash site)
Two hours after the incident, a passer by made a report to local authorities who then secured the area.
At the time of incident, the cable box was monitored in real-time by EA Technology's VisNet Hub from a nearby substation. VisNet Hub is an LV monitoring device which whilst monitoring, was able to detect the collision instantly and trigger an alert to asset managers.
Finding the Fault Location
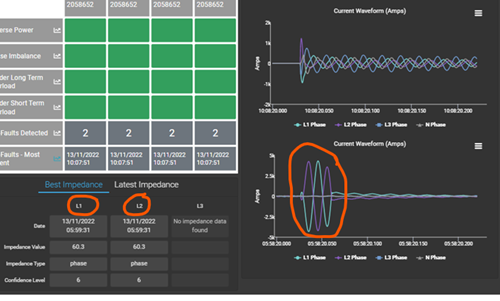
As seen in Figure 2, VisNet Hub captured a phase-to-phase peak in current which occurred at the time of collision. The current spike indicated a red phase to white phase flashover at 4,300 Amps for 1.5 cycles. However, this was not enough for the protection to operate so live LV conductors were exposed to the public. Our engineer proceeded to use the fault current waveform data to pinpoint the fault location.

(Figure 2: Data from VisNet Hub)
Impedance Analysis
The impedance analysis performed gave a phase impedance of 60.3 milliohms, indicating with high credibility the presence of fault activity. This impedance value was then mapped onto the LV feeder cable which gave a distance to fault in the range between 380 - 400 meters from the substation.
When overlaid on a map, the distance from the substation to the damaged pillar (when measured as per Figure 3) was roughly 385 meters. This closely aligns with the fault location/distance previously identified by the VisNet Hub, providing further confidence in data accuracy.

(Figure 3: Distance of fault from the substation)
Inspecting the crash site
Upon arrival at the accident site, field crew found that this was a hit-and-run car accident that had left exposed live LV conductors at the roadside, adjacent to residential properties. A flashover mark could be seen on the red and white phase bare conductors and damage was consistent with the red to white fault data recorded by VisNet Hub.
This was a safety hazard to anyone in the area as contact with live LV could have led to severe injury or death. Field crew took immediate action to cordon off the area before proceeding with repairs.
Conclusion
In summary, VisNet Hub's alarm system was effective in alerting asset owners the presence of an LV fault. The device also recorded critical data that can be remotely analysed to determine the distance to fault and the fault location despite no customers being off-supply.
This case study showed how VisNet hub can be used to detect operational situations whilst performing its monitoring duties. With the rise of renewable energy and greater loads placed on our LV networks, visibility of LV data will become more prevalent and necessary in LV network management.
More case studies here: