Think you know PD? Test your PD knowledge!
10 fun and interactive questions. Find out if you are a PD beginner or a pro today!
Start Quiz17 March 2023
Brad Monaghan

Understanding and accurately analysing partial discharge (PD) phase plots is essential for diagnosing and managing PD in high voltage (HV) insulation systems. This guide provides a comprehensive overview of phase plots, their creation, interpretation, and the critical role they play in PD diagnostics.
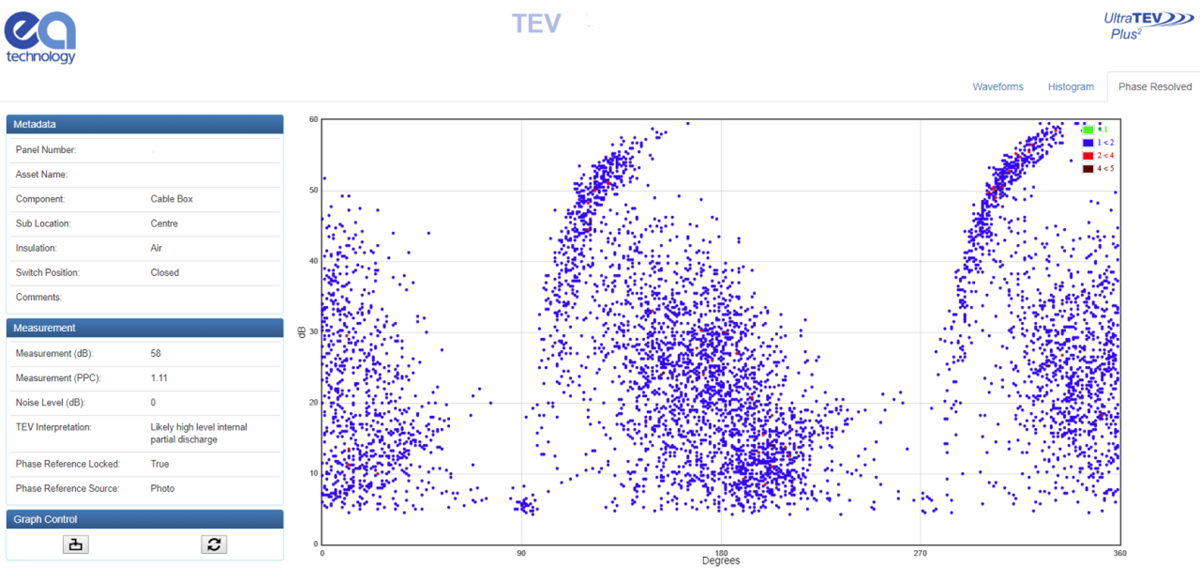
Phase plots, or Phase Resolved Partial Discharge (PRPD) patterns, are pivotal in visualising partial discharge activity within HV insulation systems. These plots illustrate PD activity across 360 degrees of an AC cycle, highlighting the defects—such as voids, gaps, and imperfections—that cause discharges due to inadequate insulation.
A PRPD pattern represents PD events relative to the AC cycle, showcasing the amplitude of each discharge event against their phase angle. This visualisation aids in identifying the type of defect causing PD, offering insights into the health of the insulation system.
Interpreting a PRPD pattern
Interpreting a PRPD pattern involves analysing the amplitude and phase angle of discharge events. These patterns are unique to the defect type and shape but exhibit common trends that can be identified to assess the severity of PD.
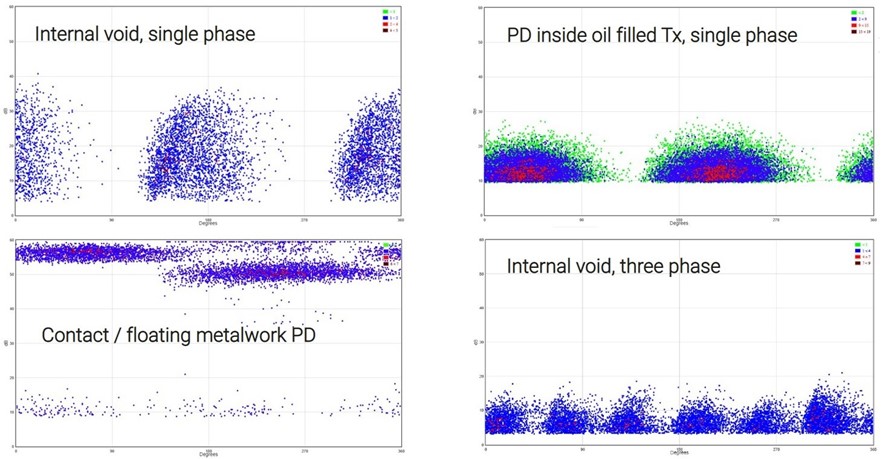
Single Phase Activity: This refers to PD occurring within a single phase of an electrical system. Defects like internal voids or poor contacts within a single insulated component or connection might predominantly exhibit single-phase activity, as the discharge is confined to the phase where the defect is present.
Two Phase and Three Phase Activity: These terms refer to PD that spans across two or three phases, respectively. Floating metal work or defects that bridge across insulation separating phases could potentially lead to two-phase or three-phase activity. Such conditions are more complex and can indicate a more severe risk to the system's integrity.
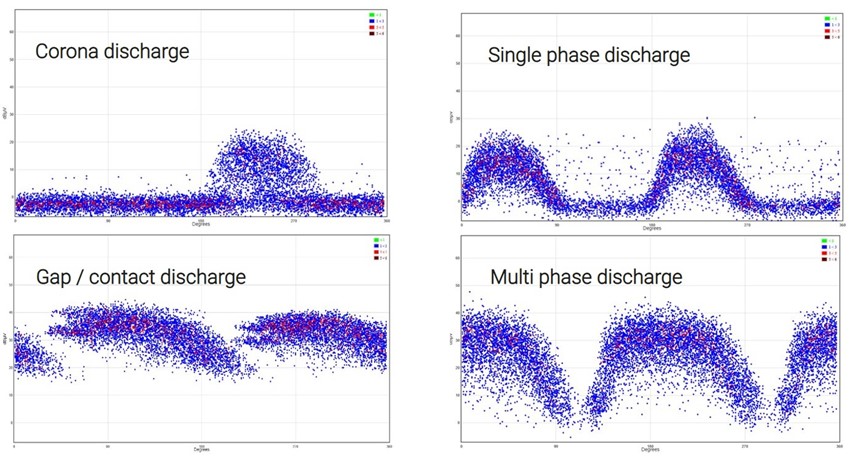
Phase to Phase Activity: This specifically involves discharge occurring between two phases, which might be seen with defects like poor contacts or floating metal work that create a conductive path between phases. Corona discharges, while typically associated with a single phase where the sharp point or irregularity is located, can also contribute to phase to phase activity if the corona effect occurs near phase boundaries.
Below graphs illustrate some of the most commonly seen PRPD patterns and its defect type:
Electromagnetic testing

Ultrasonic testing

Accurate analysis of PD phase plots is crucial for:
EA Technology's Wireless Phase Reference accessory enhances the accuracy of phase plot analysis, ensuring reliable diagnostics in any environment. Learn more about our phase analysis technology.
Analysing partial discharge phase plots is a critical skill for professionals working with high voltage insulation systems. By understanding and interpreting these plots, you can diagnose PD accurately, ensuring the reliability and safety of electrical assets.
For more insights into partial discharge and its management, download our comprehensive guide.